
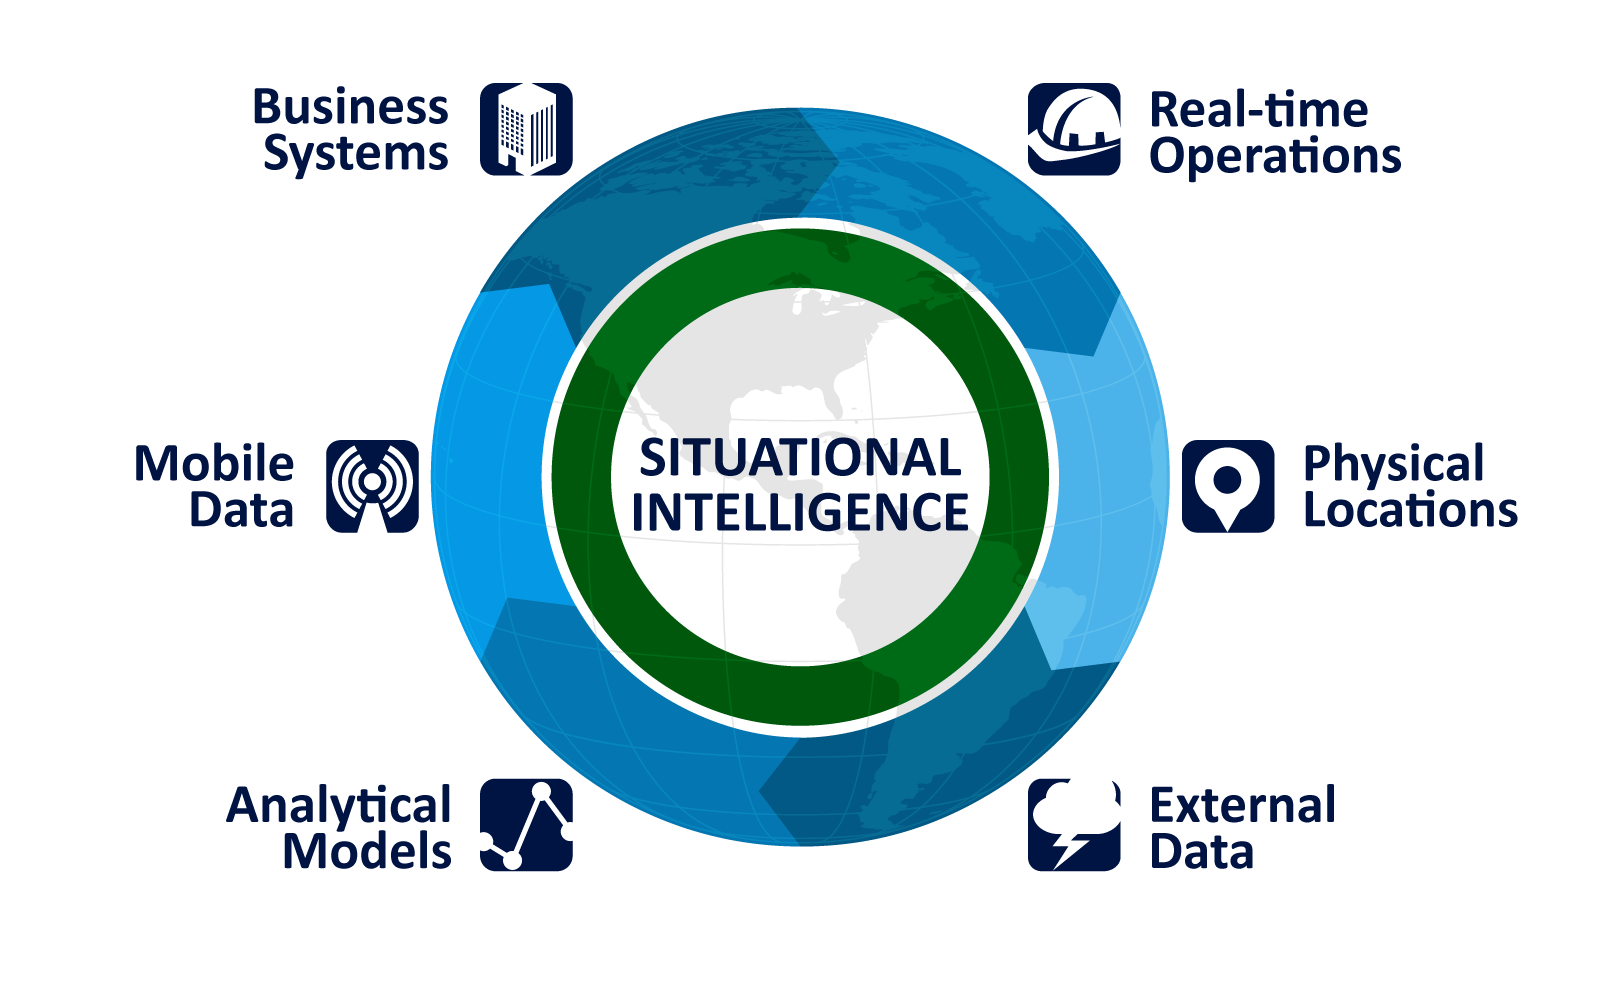
Infographic showing what was refered to as the "circle of life" for the STI technology solution. Adobe Illustrator
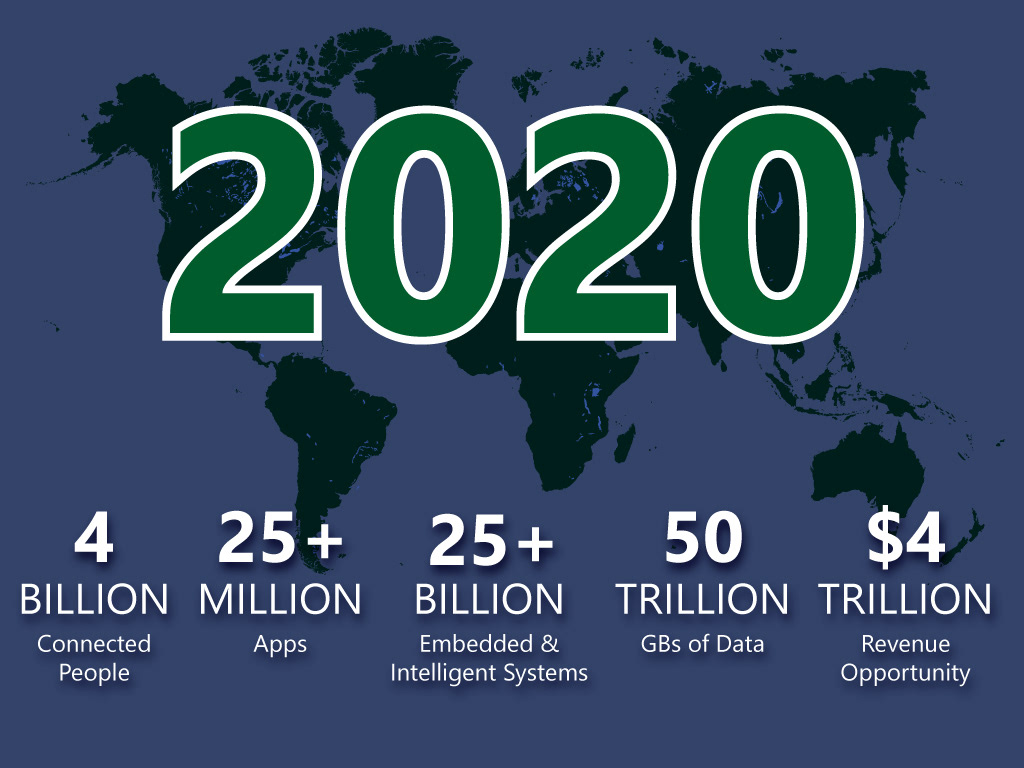
Hero image used in slide presentations and on websites showing the vast amounts of people, data and money interconnected by the Internet of Things by 2020. Adobe Illustrator

Hero image showing the numerous types of IoT assets STI software solution could help companies and industries track and analyze. Original work in adobe illustrator with some clip art included from 123rf.com manipulated to match theme of infographic and STI corporate color palette.
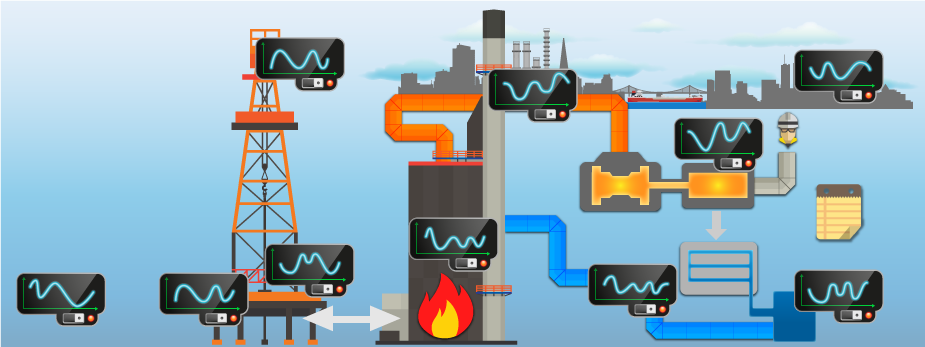
Illustration for powerpoint presentation showing energy specific lifecycle with IoT tracking devices. Adobe Illustrator

Another "circle of life" type graphic showing the cyclical process of STI solutions including the injection of custom of Agile application development using developers, analysts, and data scientists. Adobe Illustrator
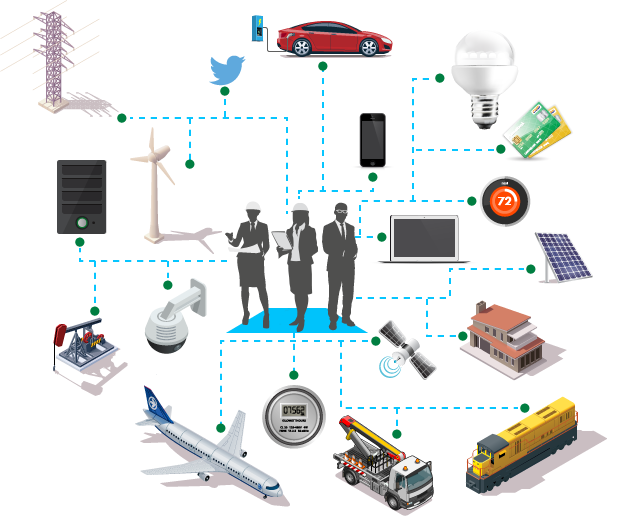
IoT slide showing assets being interconnected with various user personas as the the central focus. Some clip art from 123rf.com combined with original illustration and concept. Adobe Illustrator.

Infographic showing the energy generation-transmission-distribution cycle. Manipulation of clip art from 123rf.com as well as original text illustrations and layout. Adobe Illustrator.
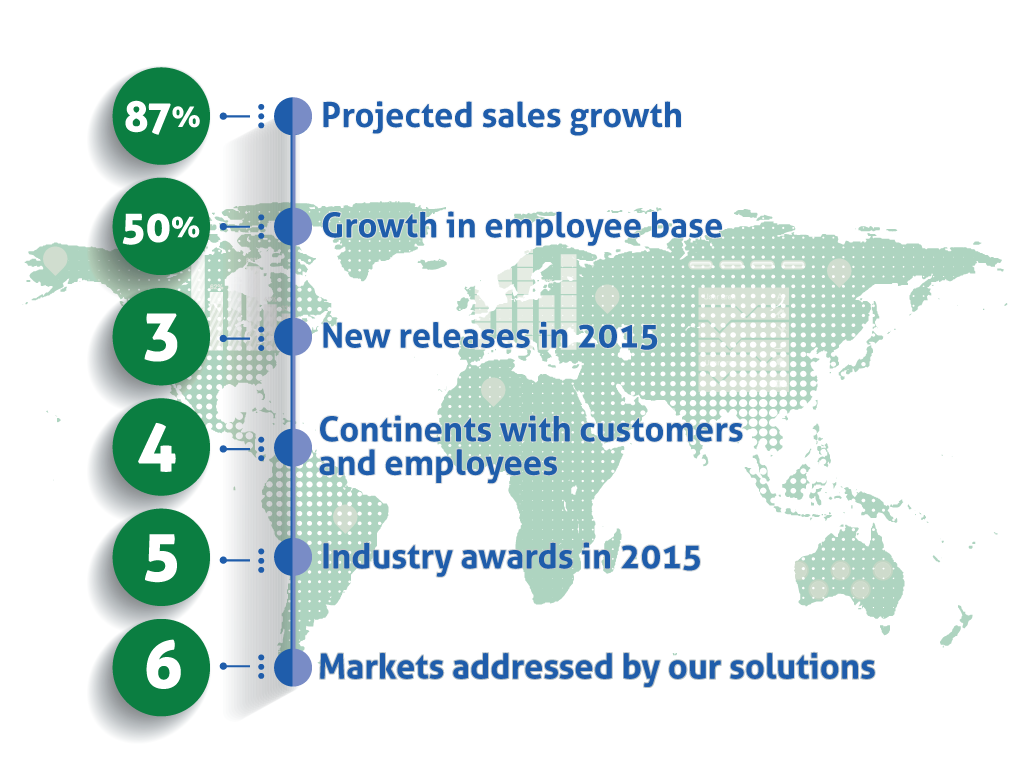
Graphic created for powerpoint and web presentation showing sales milestones. Adobe Illustrator
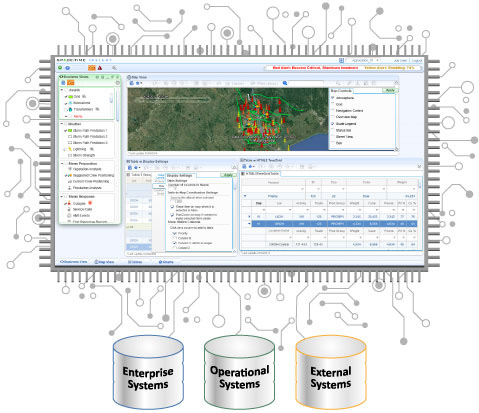
Graphic showing how the STI solution could integrate data from different system silos. All original illustration with integrated product screen shot. Adobe Illustrator.